
To analyze stocks before buying in Kenya, check the company's revenue growth, profit, and debt levels from its annual report. Study key ratios like the P/E ratio and EPS. Look for consistent profits, strong cash flow, and low debt. Avoid companies with shrinking revenue or rising losses. Always buy through a licensed NSE broker.
- What It Means to Analyze a Stock
- Fundamental Analysis for NSE Stocks
- How to Read Financial Statements
- Revenue vs Profit Explained
- Key Ratios Every Investor Should Know
- Understanding P/E Ratio
- Understanding EPS
- How to Identify Undervalued Stocks
- How to Spot Financially Strong Companies
- How Debt Affects Share Prices
- How to Analyze Bank Stocks
- Red Flags in Company Financial Reports
- How Earnings Reports Affect Stock Prices
- How Dividend Announcements Affect Share Prices
- How to Compare Two NSE Stocks
- Technical Analysis for Beginners in Kenya
- What Makes a Good Investment?
- How Investors Value Companies
- FAQs
What It Means to Analyze a Stock
Stock analysis is simply the process of studying a company closely before you buy its shares. You look at how much money it makes, how much it owes, how well it is managed, and whether its share price is fair. When you do this properly, you buy at the right price — and you avoid losing money on bad companies.
There are two main ways to analyze stocks: fundamental analysis and technical analysis. Most long-term investors in Kenya rely on fundamental analysis because it tells you whether a company is truly healthy. Technical analysis helps you decide when to buy or sell based on price patterns.
This guide covers both — and it is written so that even someone who has never bought a share before can understand it completely.
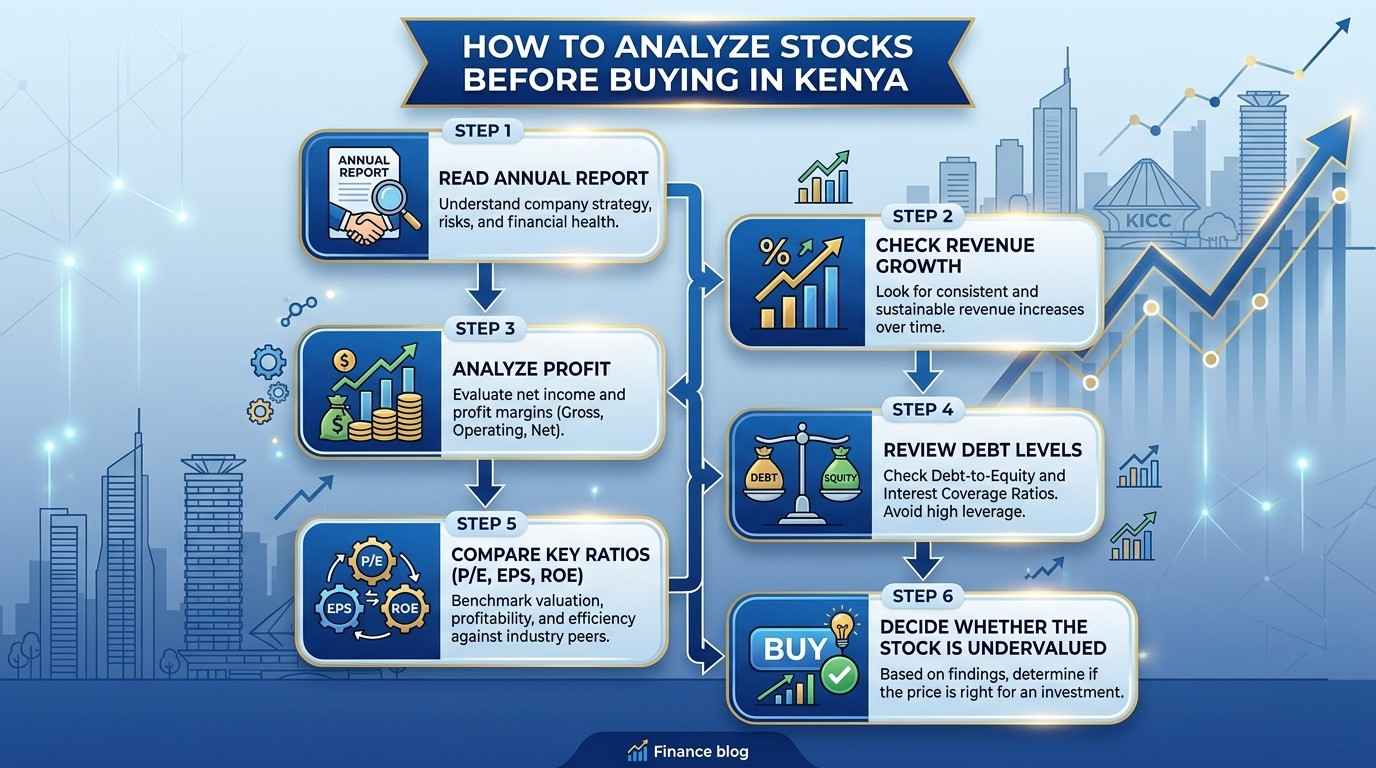
Fundamental Analysis for NSE Stocks
Fundamental analysis means studying a company's real business performance — not just its share price. You look at documents like the annual report, income statement, and balance sheet to understand whether the company is making money, managing debt well, and growing over time.
For NSE-listed companies, you can find annual reports and financial results on the Nairobi Securities Exchange website, the company's own website, or through your broker.
The key questions you want to answer are:
- Is this company making a profit?
- Is profit growing from year to year?
- Does it owe too much money (high debt)?
- Does it generate real cash?
- Is the current share price cheap, fair, or expensive?
How to Read Financial Statements
A company's financial statements are like its school report card. They tell you exactly how the company performed during the year. There are three main statements every investor must know.
1. The Income Statement (Profit & Loss)
This shows how much money the company earned (revenue) and how much it kept (profit) after paying all its costs. You want to see revenue and profit going up year after year.
2. The Balance Sheet
This is a snapshot of the company's assets (what it owns) and liabilities (what it owes) at a specific date. A strong balance sheet has much more assets than liabilities. High liabilities compared to assets is a warning sign.
3. The Cash Flow Statement
This shows the actual cash moving in and out of the business. A company can show a profit on paper but still be struggling if cash is not coming in. Always check that operating cash flow (cash from the main business) is positive.
Revenue vs Profit Explained
Many new investors confuse revenue with profit. They are very different things.
Revenue is the total money a company earns from selling its products or services. Think of it as all the money that comes through the front door.
Profit is what is left after you subtract costs, salaries, taxes, and all other expenses from that revenue. It is the money that stays with the company (or gets paid to shareholders as dividends).
| Term | What It Means | Example (Ksh Millions) |
|---|---|---|
| Revenue | Total sales income | Ksh 50,000M |
| Gross Profit | Revenue minus cost of goods | Ksh 30,000M |
| Operating Profit | Gross profit minus operating expenses | Ksh 18,000M |
| Net Profit (PAT) | Final profit after tax | Ksh 12,000M |
Always focus on net profit (profit after tax). A company with Ksh 100 billion in revenue but only Ksh 500 million in net profit has very thin margins — a small downturn could wipe profits out completely.
Key Ratios Every Investor Should Know
Financial ratios are shortcuts. Instead of reading 200-page annual reports every time, you use ratios to quickly compare companies. Here are the most important ones for NSE stocks:
| Ratio | What It Measures | Good Sign | Warning Sign |
|---|---|---|---|
| P/E Ratio | Is the stock cheap or expensive? | Below 10 (value) | Above 30 (pricey) |
| EPS | Profit per share | Rising yearly | Falling or negative |
| Dividend Yield | Income from dividends | Above 4% | 0% (no dividends) |
| Debt-to-Equity (D/E) | How much debt vs. owner funds | Below 1.0 | Above 2.0 |
| Return on Equity (ROE) | How well management uses money | Above 15% | Below 8% |
| Price-to-Book (P/B) | Price vs company's net assets | Below 1.5 | Above 4.0 |
| Current Ratio | Can it pay short-term bills? | Above 1.5 | Below 1.0 |
Understanding P/E Ratio
The Price-to-Earnings (P/E) ratio is the most widely used stock valuation tool in the world. It answers one simple question: How many years of current profit would it take to pay back the price of one share?
Formula: P/E Ratio = Share Price ÷ Earnings Per Share (EPS)
Example: If Safaricom trades at Ksh 22 per share and its EPS is Ksh 2.20, the P/E ratio is 10. This means you are paying 10 years' worth of earnings for each share.
A low P/E can mean the stock is undervalued — or that the business has problems. A high P/E can mean investors expect strong future growth — or that the stock is overpriced. Context matters. Always look at the P/E alongside other ratios and the company's earnings trend.
Understanding EPS (Earnings Per Share)
EPS stands for Earnings Per Share. It tells you how much profit the company made for each share it has issued.
Formula: EPS = Net Profit After Tax ÷ Total Number of Shares
Example: If Equity Bank makes a profit of Ksh 40 billion and has 3.77 billion shares, the EPS is approximately Ksh 10.61 per share.
EPS is important for two reasons:
- It tells you how much each share "earns" — which feeds the dividend and the share price.
- Growing EPS year after year is one of the clearest signs of a healthy business.
How to Identify Undervalued Stocks on the NSE
An undervalued stock is a share that is trading at a price lower than what it is actually worth. This is the goal of value investing — buying Ksh 100 worth of business for Ksh 60.
Here is how to spot undervalued NSE stocks:
Check if P/E is below the sector average
If most banks on the NSE trade at a P/E of 8, and one bank trades at P/E of 5, it may be undervalued — as long as there is no hidden problem.
Check if Price-to-Book (P/B) is below 1
A P/B below 1 means you can buy the company for less than the value of its own assets. That is often a bargain — though it can also signal serious problems.
Look for high dividend yield
If a company is paying consistent dividends and the dividend yield is much higher than the NSE average, the market may have underpriced the stock relative to its income power.
Compare current price to 5-year earnings trend
If profits have been growing for five years but the share price has stayed flat or fallen, the stock may be undervalued because of market sentiment — not business weakness.
Undervalued stocks require patience. They may not jump in price right away. But if your analysis is correct, the market eventually corrects the price upward.
Ready to Buy Your First NSE Share?
Faida Investment Bank is a licensed, trusted stockbroker and investment bank in Kenya. Open your CDS trading account, get expert guidance, and start building your portfolio — with as little as a few thousand Ksh.
Open an Account with Faida Investment Bank →How to Spot Financially Strong Companies
Strong companies share common traits. When you see most of these boxes ticked, you are looking at a business worth taking seriously:
- Revenue has grown for at least 3 of the last 5 years.
- Net profit margins are stable or rising — the company is not just growing revenue by cutting prices.
- Debt-to-equity is below 1.5 for non-financial companies (banks are different — they borrow by nature).
- Return on Equity (ROE) is above 15% — management is using shareholders' money efficiently.
- Operating cash flow is positive — real cash is coming into the business.
- Dividends have been paid consistently — this signals the company has real profits, not accounting profits.
- Auditor has issued a clean (unqualified) opinion every year.
On the NSE, companies like Safaricom, Equity Bank, KCB, and East African Breweries have historically met most of these criteria. That does not mean they are always the right buy at any price — but they demonstrate what financial strength looks like in the Kenyan market.
How Debt Affects Share Prices
Debt is not automatically bad. Companies borrow money to grow — to buy equipment, expand into new markets, or acquire competitors. The question is: how much debt relative to how much the company earns?
When debt is too high, three bad things can happen to your shares:
- Profit shrinks — because a large chunk of earnings goes to paying interest on loans.
- Share price falls — investors get nervous about a company that may struggle to repay debts.
- Dividend gets cut or cancelled — the company cannot pay shareholders if it is struggling to pay lenders first.
In rising interest rate environments — like when the Central Bank of Kenya raises its benchmark rate — companies with heavy debt suffer most because their borrowing costs go up.
How to Analyze Bank Stocks
Banks are different from regular businesses. They borrow money (your deposits) and lend it out at higher interest rates. Their "product" is money itself. This means you cannot use the same ratios you would use for, say, a manufacturing company.
Here are the key metrics for analyzing NSE bank stocks like Equity Bank, KCB, NCBA, Co-op Bank, and Absa Kenya:
Net Interest Margin (NIM)
This is the difference between the interest a bank earns on loans and the interest it pays on deposits. A NIM above 6% is generally strong for Kenyan banks.
Non-Performing Loans Ratio (NPL)
NPLs are loans that borrowers have stopped repaying. A high NPL ratio (above 10%) means many borrowers are defaulting — this hurts bank profits and can signal broader economic problems. Always check if the NPL ratio is rising.
Return on Assets (ROA)
For banks, ROA above 2% is considered healthy in Kenya. It shows how well the bank turns its assets into profit.
Capital Adequacy Ratio (CAR)
This measures the bank's financial cushion. The Central Bank of Kenya requires banks to maintain a minimum CAR of 14.5%. Banks with CAR well above this are safer.
Cost-to-Income Ratio
This shows how much the bank spends to earn each shilling. A ratio below 50% is efficient. Above 70% means the bank is spending too much relative to what it earns.
Red Flags in Company Financial Reports
Just as there are signs of strong companies, there are warning signs that should make you walk away. These are called red flags.
🚩 Red Flags to Watch For on the NSE
- Revenue declining for two or more years in a row — the business is shrinking, not growing.
- Profits falling while director salaries are rising — management is rewarding itself while the business suffers.
- Frequent change of auditors — a company that keeps changing its auditors may be hiding something.
- Qualified audit opinion — when the auditor adds a note saying they could not verify certain figures, that is a very serious warning.
- Negative operating cash flow despite reported profit — the company may be using creative accounting to show profit that does not actually exist as cash.
- Rapidly growing debt with no clear reason — if debt is doubling every year without matching revenue growth, ask why.
- Related party transactions that are very large — when a company buys services from companies owned by its own directors at inflated prices, shareholders lose.
- Sudden dividend cuts or cancellation — this often signals the company is in financial trouble, even before a profit warning is issued.
- Share price falling while the rest of the NSE rises — sometimes the market knows something before it shows up in financial reports.
How Earnings Reports Affect Stock Prices
Every NSE-listed company must publish its financial results — half-year (interim) and full-year (annual). These earnings announcements are some of the most powerful movers of share prices.
Here is what typically happens on the NSE when results drop:
| Earnings Result | Typical Market Reaction | What to Watch |
|---|---|---|
| Profit higher than expected | Share price rises | By how much? Is it sustainable? |
| Profit in line with expectations | Little movement | Guidance for next year matters more |
| Profit below expectations | Share price falls | Is it a one-off or a trend? |
| Profit warning issued | Sharp sell-off | Avoid catching a falling knife |
The important thing is not just whether the company made money — but whether it made more or less than investors expected. This is called the "earnings surprise." On the NSE, Safaricom's half-year results, for example, can move the entire market because it has the largest market capitalisation.
As an investor, watch the NSE announcements calendar and do your analysis before results day — not after when prices have already moved.
How Dividend Announcements Affect Share Prices
Dividends are cash payments a company makes to shareholders from its profits. When a company announces a dividend, it signals financial health — and it directly affects the share price.
Here is the typical price behaviour around dividend announcements on the NSE:
- Dividend announcement day: Share price often rises, especially if the dividend is higher than last year.
- Book closure date: You must own the share before this date to receive the dividend.
- Ex-dividend date: The share price usually drops by roughly the dividend amount on this day, because new buyers will not receive the upcoming dividend.
- Payment date: Cash hits your CDS account — usually several weeks later.
If a company cuts or skips its dividend, the share price usually falls sharply — because it signals the company is struggling. Watch Equity Bank's dividend history and the Safaricom dividend payout history to understand how consistent dividend payers behave over time on the NSE.
How to Compare Two NSE Stocks
Say you want to invest in a Kenyan bank. You are deciding between two options. How do you choose? Here is a simple side-by-side framework:
| Metric | Company A | Company B | Better Pick |
|---|---|---|---|
| Share Price | Ksh 45 | Ksh 30 | — |
| P/E Ratio | 7.5 | 12.0 | A (cheaper) |
| EPS (Ksh) | 6.00 | 2.50 | A (more earnings) |
| Dividend Yield | 5.5% | 2.1% | A (higher income) |
| ROE | 22% | 11% | A (better managed) |
| 5-Year Revenue Growth | +68% | +15% | A (faster growth) |
| NPL Ratio (bank-specific) | 8% | 14% | A (cleaner loan book) |
In the above example, Company A wins on nearly every metric — yet its share price is higher. That is fine. Paying more for a better business is often smarter than buying a cheap share in a poor company.
But always go beyond the numbers. Ask: Who is the management team? What is their track record? Are there regulatory risks? Is the industry growing or declining?
Start Investing in NSE Shares Today
Faida Investment Bank helps Kenyan investors buy and sell NSE-listed stocks with professional support. Whether you are starting with Ksh 5,000 or Ksh 5 million, they provide licensed brokerage services, portfolio advice, and market research.
Get Started with Faida Investment Bank →Technical Analysis for Beginners in Kenya
While fundamental analysis tells you what to buy, technical analysis helps you decide when to buy or sell. It studies past share price movements and trading volumes to predict future price direction.
You do not need to be a mathematician to use basic technical analysis. Here are the key concepts:
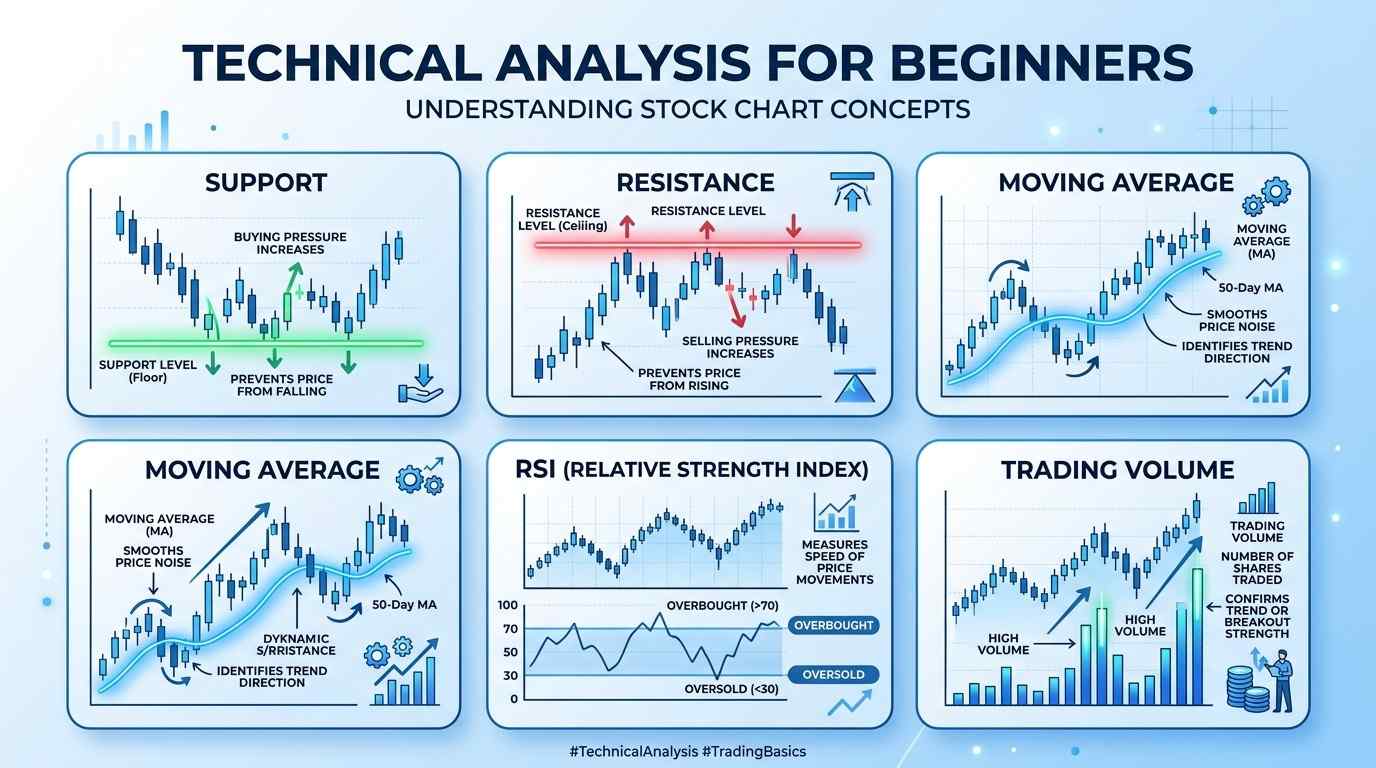
Support and Resistance Levels
A support level is a price where a falling share tends to stop and bounce back up — because buyers appear at that level. A resistance level is a price ceiling where a rising share tends to stop — because sellers appear. When a share breaks through resistance, it often moves up strongly.
Moving Averages (MA)
A moving average smooths out day-to-day price noise to show the underlying trend. The 50-day MA and 200-day MA are widely used. When the 50-day MA crosses above the 200-day MA, it is called a "Golden Cross" — a bullish signal. The opposite crossing is a "Death Cross" — a bearish signal.
Relative Strength Index (RSI)
RSI measures whether a share is overbought (above 70 — possibly due for a fall) or oversold (below 30 — possibly due for a rise). For NSE beginners, watching RSI helps you avoid buying at the very top of a short-term price spike.
Volume
Volume is the number of shares traded in a day. A price rise on high volume is more convincing than one on low volume. If a share's price rises but volume is very thin, the move may not hold.
What Makes a Good Investment?
A good stock investment has four things working in its favour:
- Quality business — the company has a competitive advantage (called a "moat") that makes it hard for rivals to take its market share. Safaricom's M-Pesa is a classic example.
- Good management — the people running the company are honest, competent, and focused on shareholders' interests.
- Fair or cheap price — you are not overpaying. The P/E, P/B, and dividend yield all suggest you are getting value.
- Right timing — you have used technical analysis to pick a sensible entry point rather than buying at the top of a rally.
Great investors like Warren Buffett call this buying "wonderful companies at fair prices." On the NSE, this means identifying Kenya's most resilient businesses — those with dominant market positions, consistent profits, and honest leadership — and buying them when valuations are reasonable.
You can find more ideas on how to grow money in Kenya in our guide to the best investment guides on KE Offers.
How Investors Value Companies
Professional investors use a range of tools to decide how much a company is actually worth — what they call its intrinsic value. Here are the most common valuation methods you will encounter:
Discounted Cash Flow (DCF)
This method estimates all the future cash a company will generate and discounts it back to today's value. It is considered the most accurate method, but it requires detailed forecasts and makes assumptions about the future that can easily be wrong.
Comparable Company Analysis ("Comps")
You compare the company's valuation ratios (P/E, EV/EBITDA, P/B) with similar listed companies. On the NSE, you might compare all listed banks to find which one is cheapest relative to its peers.
Dividend Discount Model (DDM)
This values a share based entirely on its expected future dividends. It works best for mature, stable dividend-paying companies — exactly the kind you find on the NSE, like Safaricom or Kenya Power.
Asset-Based Valuation
This looks at what the company's assets are worth if you sold them all today and paid off all debts. It is most useful for holding companies or asset-heavy businesses like property companies.
For most Kenyan retail investors, sticking with simple ratios — P/E, EPS growth, ROE, dividend yield, and debt levels — gives you 80% of the insight you need without the complexity of full DCF models.
Frequently Asked Questions
Start with fundamental analysis: read the company's income statement, balance sheet, and cash flow statement. Check key ratios like the P/E ratio and EPS. Look for companies with growing revenue, low debt, and consistent profits. Then use technical analysis to pick a good entry price. Always buy through a licensed NSE broker like Faida Investment Bank.
On the Nairobi Securities Exchange, a P/E ratio below 10 is often considered low (possibly undervalued), while above 20 may mean the stock is expensive relative to earnings. Always compare the P/E of a company with others in the same sector rather than using a universal rule.
EPS stands for Earnings Per Share. It tells you how much profit a company made for each share it has issued. A higher and growing EPS is a good sign — it shows the company is making more money per share over time. You calculate it by dividing net profit by the total number of shares outstanding.
Red flags include falling revenue for two or more consecutive years, growing debt with shrinking profits, negative operating cash flow despite reported profit, frequent changes of auditors, qualified audit opinions, and suspiciously large related-party transactions.
When a company releases strong earnings (higher profit than expected), its share price usually rises. Weak earnings cause prices to drop. In Kenya, major results from companies like Safaricom and Equity Bank can move the entire market significantly. Watch the NSE announcement calendar and analyze companies before — not after — results day.
You need a licensed stockbroker or investment bank. Open a CDS (Central Depository System) account and a trading account, then place your buy orders through your broker. Faida Investment Bank is a trusted, licensed NSE broker with a good reputation among Kenyan retail investors.
Revenue is all the money a company earns from selling its products or services. Profit is what remains after all costs, salaries, taxes, and expenses are subtracted from revenue. A company can have high revenue but still make a loss if its costs are too high. Always focus on net profit (profit after tax) when assessing a company's health.
When a company announces a dividend, especially one higher than the previous year, its share price often rises. On the ex-dividend date, the price typically falls by roughly the dividend amount. If a company cuts or cancels its dividend, the share price usually falls sharply as investors lose confidence.
There is no fixed minimum amount set by the NSE itself. The minimum depends on the broker and the share price of the stock you want to buy. Some brokers allow you to start with as little as Ksh 5,000. You will also pay brokerage commission (typically around 1.5-2.1% of transaction value) and CDS fees.